
How to Prioritize Security Controls When Your Effectiveness Data Is Unreliable
A new framework argues that where you place a control in your network matters more than how well it performs — and that optimizing for the worst case might be costing you.

How do you measure the effectiveness of a security control that has never been breached? Is it 100% effective, or has it simply not been tested by a sophisticated enough adversary?
This question sits at the center of every cybersecurity budget conversation. Mathematical models for security investment rely on precise effectiveness metrics — a firewall stops 85% of attacks, a patch reduces exposure by 60%. But those numbers are rarely grounded in reliable data. Organizations underreport breaches to protect their reputation. The threat landscape shifts faster than datasets can be assembled. And for controls that haven’t yet failed, we have no failure data.
A 2025 paper in Computers & Security, titled “Dealing with uncertainty in cybersecurity decision support,” proposes a different approach: stop chasing precise metrics and start building investment strategies that hold up even when the numbers are wrong.
The Framework: Attack Graphs with Uncertain Edges
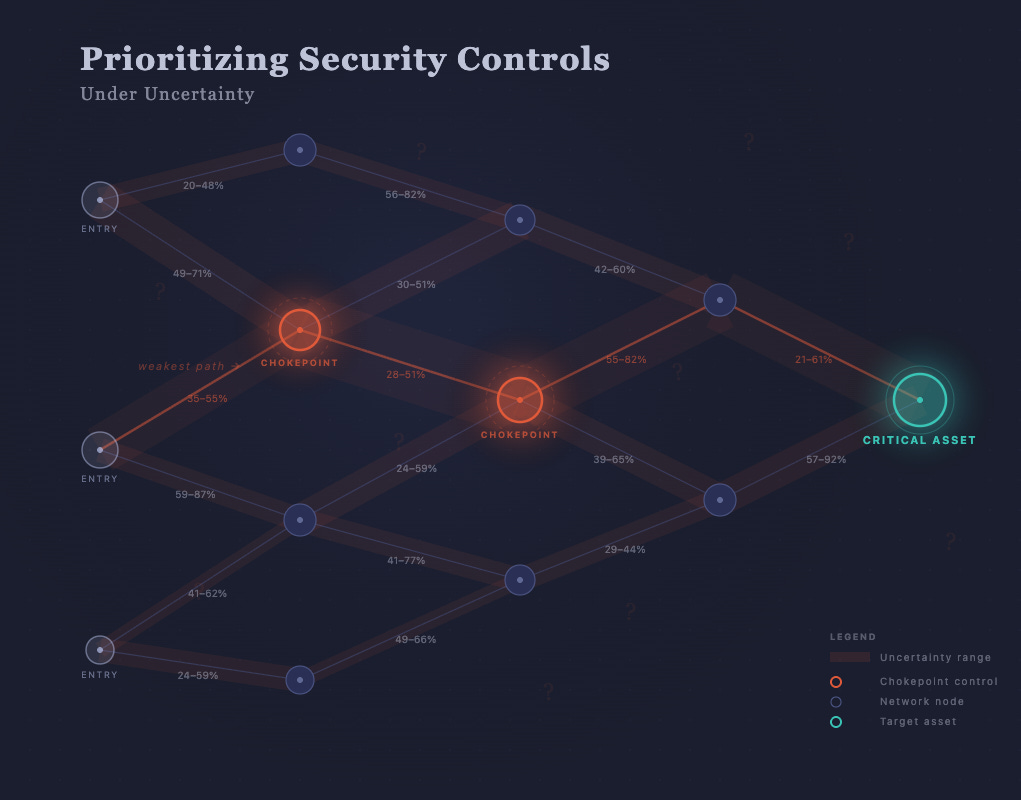
The researchers model organizational risk using probabilistic attack graphs — directed graphs where each edge represents a step an attacker must complete to reach a target asset. Every edge has a probability of success, and defenders lower those probabilities by deploying security controls, subject to a fixed budget.
The key difference from standard models: instead of assigning each control a single effectiveness value, the framework uses interval estimates. A firewall isn’t “60% effective” — it’s “somewhere between 40% and 70% effective.” This reflects what practitioners actually know: a range, not a point.
The question then becomes: given these ranges, how do you choose a portfolio of controls that performs well regardless of where the true values fall?
Two Strategies for Deciding Under Uncertainty
The paper evaluates two approaches:
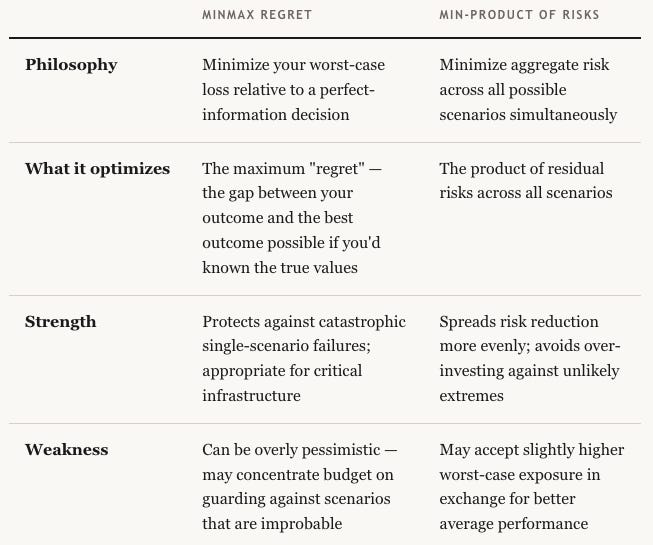
Across extensive simulations, min-product consistently delivered more balanced risk reduction. Minmax regret tended to over-allocate budget to defend against extreme corner cases, leaving more probable attack scenarios underprotected.
When to use which
Minmax regret still makes sense when the downside of a single failure is existential, think power grid SCADA systems or medical device networks. For most enterprise environments where you’re balancing dozens of controls across a broad attack surface, min-product gives you more resilient coverage per dollar.
The Biggest Finding: Topology Beats Effectiveness
The most actionable result from the paper has nothing to do with which optimization strategy you pick. It’s this:
The location of a control in your attack graph is often more important than its specific effectiveness.
If a control sits on the only path between an attacker’s entry point and a critical asset, a chokepoint, it must be funded regardless of uncertainty about its performance. Even a mediocre control at a chokepoint reduces risk more than a high-performing control protecting a redundant path.
Consider a practical example: a VPN gateway is the sole entry point to an internal database cluster. Even if you’re uncertain whether the gateway blocks 50% or 80% of unauthorized access attempts, it’s the mandatory investment. A best-in-class endpoint detection tool deployed on workstations that have three other paths to the same database won’t move the needle as much.
What this means in practice
Map your attack graph before optimizing your budget. Identify single-path chokepoints. These are your non-negotiable investments.
Don’t over-index on vendor-reported effectiveness metrics. A control’s position in your topology can matter more than whether it scores 85% vs. 92% in a lab.
Use uncertainty as a planning input, not an excuse to delay. Interval estimates (”40–70% effective”) are honest and actionable. Waiting for a precise number that will never arrive is not.
A Quick Note on the IoT Case Study
The researchers validated their framework against home IoT security bundles — comparing an integrated security app paired with cyber-insurance against a standalone custom Intrusion Detection System (IDS). At lower budgets, the app-plus-insurance bundle was more resilient because it covered more of the attack graph at a lower cost. At higher budgets, the custom IDS dominated because it could be tuned to specifically close the highest-risk paths.
The lesson generalizes: budget level changes optimal strategy. A framework that accounts for uncertainty will naturally recommend different portfolios at different price points, which is more realistic than models that output a single “optimal” answer.
Ref: https://www.sciencedirect.com/science/article/pii/S0167404824004589?ref=pdf_download&fr=RR-2&rr=9ed82a967d335e49